Arley Titzler

Recent advances in remote sensing and computational power have allowed scientists to overcome a stubborn obstacle, which limited their ability to calculate the total volume of glacier ice in the world. Since satellites look down on the world’s glaciers, total area is simpler to measure. But to estimate volume, it is necessary to know how thick glaciers are. As climate change progresses, ice thickness data can help researchers develop more accurate estimates of global glacier volume, and in turn, regional freshwater reserves and potential contribution to sea-level rise.
Producing accurate ice-thickness estimates, however, has proven difficult. In the absence of direct measurements for most of the world’s glaciers, previous studies primarily relied on models built from thickness estimates obtained by using ice-penetrating radar. These show that glaciers that are larger in area also tend to be thicker.

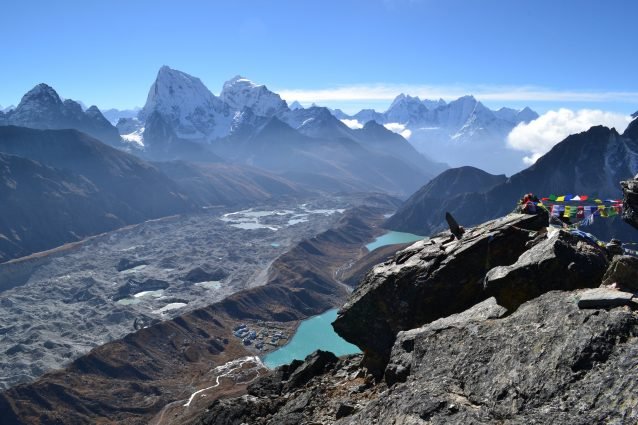
In a recent study in Nature Geoscience, researchers used, for the first time, a five-model ensemble to measure the ice thickness distribution of the world’s 215,000 glaciers, excluding the Greenland and Antarctic ice sheets. They estimated the total global glacier volume at 158,000km2. When broken down by region, they found that High Mountain Asia (HMA), comprised of the Tibetan Plateau and neighboring mountain ranges, has 27 percent less ice than previously thought and could lose at least half of its glacier area by the mid 2060s.
“In light of the importance of glacier melt for regional water supply, these differences are unsettling,” remarked the researchers in the study.

Much as a traffic helicopter can measure the speed of cars by comparing photos taken over intervals, which allow them to trace individual cars, recent satellite imagery allows scientists to observe specific features on the surface of glaciers as they progress downslope. Researchers used the Randolph Glacier Inventory (RGI) 6.0, which contains surface topography information for 215,000 glaciers. Then, they employed principles of surface ice flow dynamics—for example, thicker ice moves faster, and ice overall moves faster when the slope of a mountain is steeper—to obtain estimates of ice thickness.
This study builds on the results of an earlier version published in 2012, that was “mainly born out of the realization that wow, up to that stage, there was no estimate for the global glacier ice thickness distribution available at all,” Daniel Farinotti, a glaciologist at the Swiss Federal Institute of Technology in Zurich told GlacierHub. The 2012 study also used the RGI 2.0, which counted 26 percent less total glaciers, and calculated ice thickness estimates based on just one model.
The 2019 study’s volume estimate was just 7 percent less than in 2012, a gap mainly attributable to model differences. That said, the regional distribution of glacier ice volume in 2019 was much different, measuring a 24 percent increase in the Antarctic periphery, which was offset by decreases in the Arctic, the southern Andes, and the 27 percent decrease in HMA.

Matthias Huss, a glaciologist at the Swiss Federal Institute of Technology in Zurich and University of Fribourg, described to GlacierHub one way the 2019 study improved upon the results in 2012. “Whereas the 2012 study was ONE (the first) model for global glacier ice thickness distribution, in the present study FIVE different models were applied, developed by different research groups and with partly different underlying parameterizations,” he said. “This allows providing a “consensus” estimate, and to narrow down uncertainties.”
Both Farinotti and Huss agreed that the RGI 6.0, coupled with better satellite imagery, also made major contributions to the 2019 estimates, especially considering the significant differences between regions. Farinotti explained to GlacierHub how the improved RGI 6.0 could impact these estimates. “If a large glacier is split into two or more parts, the estimate thickness is significantly smaller,” he said. Farinotti also provided a concrete example, explaining that two glaciers each with an area of 10km2 would have significantly less ice volume than one glacier with a 20km2 area.
This study offers important findings to the hundreds of millions of people in High Mountain Asia that depend on glacier runoff as a source of freshwater. Based on the 2012 study, glacier area in HMA was likely halve by the end of the 2070s, but the new study moves this estimate up more than a decade, to the mid 2060s.
Glaciers “Knowing how thick [glaciers] are is equivalent of knowing how much cash we have in a bank account,” said Farinotti. According to this study, water reserves in High Mountain Asia are much smaller than previously believed. This could have significant impacts on how planning for future water use might take place, and highlights the importance of mitigation measures in response to rapid global climate change.–Courtesy: GlacierHub
 Arley Titzler is a writer at GlacierHub. She works at the Bren School of Environmental Science and Management as an IT assistant.

The High Asia Herald is a member of High Asia Media Group — a window to High Asia and Central Asia

